Showing posts with label GIS. Show all posts

Monday 3 August 2020

Benefits of GIS in Urban Planning

Benefits of GIS in Urban Planning 

Investigating the Squatter Settlements in Eskisehir, Turkey


Traditional methods of information management are hard to use in the planning process of problematic urban areas such as squatter settlements. GIS provides the capability for dynamic query and analysis, display of information and a more understandable representation. By introducing GIS, the authors analyse the social and infrastructure possibilities of the squatter settlements in Eskisehir Municipality. They determine areas with inadequate public services and infrastructure, and provide basic solutions.

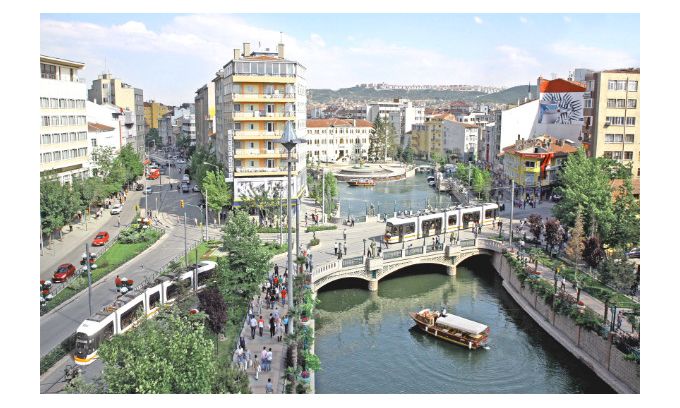
The problems of large metropolitan cities have been comprehensively studied by many researchers. Nevertheless, a country that just consists of a few very large urbanised areas arbitrarily embedded in a rural context is not viable and not optimally sustainable. A network of medium-sized cities that are evenly distributed over the territory is more feasible. Therefore it is important to also investigate the problems of these smaller cities. The city of Eskisehir, Turkey, has been chosen as a case study. This city is located in the northwest of Anatolia at an equal distance from the primary metropolis Istanbul and the capital Ankara.

center of Eskisehir, Turkey

The city Eskisehir in Turkey

Demography: increase people living in urban areas

Turkey’s urban population has grown from 23.6 million in 1985 to 44.1 million in 2000. During this 15-year period, the proportion of people living in urban areas has increased from 45.2% to 65.1%. These figures show that although Turkey’s level of urbanisation is lower than in western countries the rate of growth is very high. One of the worrying results is the uncontrolled settlement of low-income families in squatter areas. Housing is a basic human right, but without effective control it may harm the ecological balance. The construction of informal houses was not common in Eskisehir until the 1970s. As a result of rapid industrialisation, housing stock became insufficient after the 1970s and squatter settlements started to concentrate around industrial sites and along the main roads. Today, about 30% of the population lives in squatter areas. In 1997, over 154,000 people lived in the 16 squatter areas, whilst in 2000 the number had risen to nearly 169,000. Settlement is made easy by property developers who divide the land into parcels, often illegally. The developers do not put much effort into constructing basic services because their main interest is profit; they are not concerned with living standards or environmental balance.

Planning and GIS

Planning involves determining appropriate future decisions and actions through a series of choices. Making choices requires, in addition to thorough planning knowledge, comprehensive (geo-)data about the past, present and future. The information may be descriptive, predictive or prescriptive in nature. Appropriate and efficient management of information greatly improves the quality of planning. Generation of the proper type of information is very difficult with manual methods. GIS provides many basic functions for appropriate and efficient management of geo-information. Essentially, GIS supports the collection, maintenance, analysis and display of spatially related information. GIS data enable multiple viewpoints to be considered and provide the capability for dynamic query and display of information, and a more understandable representation. On the other hand, the accessibility of digital data may cause abuse and misuse, raising fundamental issues of data security, responsibility and reliability.

Understanding the planning area

Statistics, reports, articles, aerial and close-range photos, satellite images, maps and drawings all aid in understanding the planning area and its problems. Alternative solutions may be developed by importing this data into computer models. These models may predict, for example, demographic changes and land use modifications or simulate traffic flow. Often these computer models are implemented as stand-alone software. GIS facilitates by providing digital geo-data and display of intermediate and final results. Arriving at the most appropriate solution requires communication and collaboration among many stakeholders. Communication is best done through visualisations such as images and maps rather than through bare text. GIS is a perfect visualisation aid. So, GIS makes model creation and interpretation easier and provides understanding that may otherwise not be achieved.

Database

A database was created by an extensive survey of land use and population statistics of Eskisehir. All analogue maps and plans were scanned, and blocks and buildings digitised. Numerical data were converted into tables, graphs and maps. A basic image and GIS layers were created as thematic maps in a topological data structure. Topologically coded geo-data enables spatial query and analysis whilst large and complex sets of diverse data types can be efficiently managed. Issues such as insufficiency of public services and infrastructure and accessibility of public services can in this way be addressed more easily than by traditional methods. All the themes such as districts, public facilities, blocks and houses were stored as separate layers, which can be easily represented graphically. Many layers were created using the basic image as source. Data created with the Turkish GIS software package NetCAD were converted to data compatible with ArcGIS 8.3.

Analysis

The analysis and overview are based on relevant literature, amnesty laws, statistics from the State Statistics Institute created in 2000, maps, master plans and reconstruction improvement plans (upgrading), field surveys, data from concerned authorities and from the reports written by these authorities and organisations. The parameters used during analysis included:

  • population
  • number of storeys
  • sufficiency of public services according to the planning standards
  • walking distances to public services
  • area of public services.


From the descriptive information such as infrastructure, population data and area of the districts, the following parameters were derived:

  • floor area coefficient of the houses
  • presence of basic services and infrastructure in uncontrolled settlements.


Results

As a result of legislation of squatters by amnesty laws and weakened fear of demolition of houses, the number of the squatters has increased year after year. After the last amnesty laws, municipalities were allowed to upgrade district plans and increase the number of storeys to four. Compared to standards and law, public services are inadequate; the ratio of services to the number of people is low and walking distances are too high. Even the ratio of proposed public services to the existing population is too low according to the standards defined in developmental regulations. While 98% of the houses in 1989 had a septic tank, in 2002 60% of the houses were connected to the sewer system, 39% had a septic tank and 1% did not have any disposal system. Nearly all buildings have electricity and indoor running water (99.2% and 91.5%, respectively). These proportions are larger than Turkey’s average. None of the districts are connected to a source of natural gas. Suitability factors, factor scores, factor weights and permitted land use conversions can be specified for all land use by using GIS. Automated mapping allows the efficient handling and dissemination of thematic information enabling quick map making for planning and decision making.

Conclusions

Housing demands in Eskisehir will increase in the foreseeable future. To prevent future settlement of squatters, the following has to be done:

  • Eskiºehir Municipality should take preventive measures by identifying possible development areas for settlement in agreement with development of industrial sites, housing areas proposed in the master plan, municipal services, public land and the transportation network
  • after identification of settlement areas, site and service specifications should be ensured by constructing roads, water and electricity supply, drains and sewerage, layout of plots and service areas
  • the use of GIS techniques should be stimulated to support settlement development by using planning models and scenarios and proper data in digital format.


Google Maps: Eskisehir


Read more about GIS
Read more about Urban Planning

Thursday 22 August 2019

The history of ArcGIS

The history of ArcGIS

EsriEnvironmental Systems Research Institute, knew there was a starving market for location-based systems also known geographic information systems (GIS). In 1990s, Esri started working on a product that later became one of the best enterprise solutions for GIS implementations on Windows systems. In 1999, ArcGIS was released. Since then, ArcGIS hasbecome the most used commercial GIS solution. ArcGIS was then renamed ArcGIS for Desktop, and the ArcGIS name was used as a product line instead to carry lots of products under it.
Buy Surveyors Ebooks  herehttps://payhip.com/HeroizuTechng

When the Web started to become ubiquitous in early 2000s, Esri adopted the Web by rolling in ArcGIS for Server and gradually ArcGIS functionalities as web services so that it could be supported on multiple platforms including mobile phones.

A decade later when the cloud solutions began to surface, Esri released its Software as a Service (SaaS) solution ArcGIS Online. Designed to simplify the user experience, ArcGIS Online hides all the ArcGIS "contraptions" and technologies to relieve the user from maintaining the hardware and software, leaving the user to do what they do best, mapping. Having everything in the cloud allows users to focus on their work instead of worrying about configurations, spinning up servers and databases, and running optimization checks.

Note

SaaS, a cloud-based software distribution model where all infrastructure, hardware, management software, and applications are hosted in the cloud. Users consume the applications as services without the need to have high-end terminal machines.

Today, Esri is pushing to enhance and enrich the user experience and support multiple platforms by using the ArcGIS Online technology.

In this book, we target one of the core products of the ArcGIS family—ArcGIS for Desktop. By using real-life examples, we will demonstrate the power and flexibility of this 16+ year-old product ArcGIS for Desktop. We are going to use the various tools at our disposable to show how we can extend the functionality of ArcGIS for Desktop.


You are currently viewing a FREE SECTION

Get access to all of Packt's 7,000+ eBooks & Videos
Over 100 new eBooks and Videos added each month
10-day FREE trial. Renews at $9.99 per month


Skill Up with Packt

Wednesday 21 August 2019

FUSING IN CAD CAPABILITIES INTO GIS. BY HONEST S. O. U.

FUSING IN CAD CAPABILITIES INTO GIS.       BY HONEST S. O. U.              

ArcGIS as a GIS software lacks some cartographic capabilities for drafting of work. We are often left with converting/ exporting our GIS work into a CAD environment and after some modifications in CAD environment, the work is exported back to ArcGIS environment. GIS lacks some conventional cartographic signs and symbols and does not allow free sketching of such signs/ symbols, a times we make do with Adobe Illustrator and other softwares to aid us.        The question therefore is,  how can we fuse in CAD capabilities into GIS environment?  I found out a simple method of doing this. You can convert your shape file to CAD file. Without closing the ArcGIs, open the CAD file and do the necessary modifications on the CAD  work. Use layer plotting for all text files, signs and symbols so that they can come out as layers in ArcGIS. After all the modifications both the layout and adjustments in the digitized features (Point, Line and Polygon) .Save your CAD work and open your ArcGIS file which u minimized and you will find all the modifications on your ArcGIS.                      Cheers.

STEPS FOR CONVERTING YOUR ArcGIS SHAPE FILE TO CAD.                                    1.Goto ArcToolbox.                     
2.Select Conversion Tools.                                     3.Select to CAD. Select ,Export to CAD.           Under Input Features, (select the shape files you want to convert). Under Output Type( select the DWG- the AutoCAD version u want to save it),  Under output file(Select the folder you want to save it).                                           4. Select Ok and wait for the files to convert/export to CAD. When its successful, it pops out successful message on the ArcGIS environment

Friday 10 May 2019

How to Converting a .jpg map into a shapefile In Arcgis

Converting a .jpg map into a shapefile

First 

There is no direct route to convert an image into a shapefile format. Your jpg map has no spatial reference. You can load it into arcmap but it won't know where to put it. In order to tell arcmap where it belongs in space you have to provide geographic reference points, hence the term 'georeferencing'.

In ArcGIS this is done via the Georeferencing Toolbar, which is turned off by default. To turn it on you just right-click on a toolbar, look for Georeferencing and turn it on. Then you will use the 'Add control points' tool (first button after right of the combo box) to tell arcgis what points on the image correspond to points on a second data source that already has a spatial reference.

Here are the steps I recommend following:

  1. Open a new arcmap document.
  2. Load an existing, vector shapefile of the counties you are interested in
  3. Load the jpg of the map you want to georeference
  4. In the Table of Contents, right click on the map and select 'Zoom to Layer'
  5. Click on the 'Add Control Points' button on the georeferencing toolbar
  6. Find a point on the map that you can match to the shapefile you loaded in step 2 and click on it. I recommend finding places that are easy to identify such as intersections of major roads, sharp corners in boundaries, etc
  7. Then click on the 'Previous Extent' arrow on the toolbar to zoom back to your shapefile and move the map so that you can see the point you picked in the previous step in the shapefile.
  8. Click on the corresponding point in the shapefile. You should see your map appear in the vicinity of where you clicked. It may be very small, or it might be huge, don't worry, you'll fix that with the next step.
  9. Now you are going to repeat the last two steps using a second point on the jpg map, preferably one that is relatively far from the first one, but just go with what you can for now.
  10. Repeat the process a few times and try to get the jpg as closely matched to the shapefile as possible. You'll never get it 100 percent accurate, but you can get pretty close if you try. If something goes crazy and the map gets really distorted you can either start over entirely or delete the last control point you added using the 'View Link table' button on the georeferencing toolbar.

Then it's just a matter of either editing your existing shapefile or creating a new one using the jpg map as a background. You'll probably have to assign some attribute data such as "Damaged" or "County Name" to the polygons you draw but that is a whole other issue.

I'm sure it sounds complicated if you've never done it before but it's really pretty easy once you get your head around the concept. Just remember that there are three fundamental steps here 1) Georeference the jpg so your GIS knows where it is in space, 2) Create a new dataset from the jpg in vector format, 3) Use the attribute table from your new dataset to conduct your analysis.

Here are some links that may be helpful: Get A - Z of Arcgis text book from HeroizuTech Services Ltd

http://www.heroizutech.com.ng 

For the second phase you will have to create a new shapefile. You will use the editing tools inside arcmap to digitize the affected areas as new polygons.

1) Create a new shapefile. Open up arcCatalog and navigate to the folder you are working in. Right click and select New --> Shapefile...

2) Give your shapefile a name and under feature type select 'Polygon'

3) Click the Edit... button in the lower right and select the coordinate system you want to work with, this should probably be the same as the one used by the county base file you used to georef the map jpg.

4) Open your arcmap document with the georeferenced jpg map and add your new shapefile to the document.

5) Right click on your new shapefile in the Table of Contents, got to 'Edit Features' and select 'Start Editing'.

6) Now you can use the 'Create Features' window to digitize the affected areas on your jpg map. Make sure to save your edits often using the Editing Toolbar.

7) Once you have drawn/digitized over all the affected areas save your edits and click on the 'stop editing' button.

8) Right click on your shapefile in the table of contents and select 'Open Attribute Table'. In the window that pops up, click on the drop-down button in the upper left and select "Add Field"

9) Name your field 'Area' and select 'Double' under type.

10) You should see your new field show up as a column on the right of your attribute table, right click on its heading and select 'Calculate Geometry', choose area and the units you want, this will tell you the area of each of the polygons you digitized.

That should give you everything you need to show the affected areas on a map and calculated the total area. Again, if you need further details or more instructions these steps have been heavily documented all over the web and a search for 'arcgis create shapefile' or something similar will give you lots of results with pictures/video that will be more descriptive than my summary.


Regarding your last comment: You should now have three items in your table of contents. One should be the jpg map you georeferenced, a second should be the county map you used to georeference the jpg map, and the third should be the polygons of affected areas you just digitized.

To make a map that you can export and use as an image or figure somewhere else (ie a report or webpage) you will need to switch ArcMap over to 'Layout' view. (Go to the 'View' menu and choose 'Layout View') This is where you can add items like a legend, north arrow, and scale (via the Insert menu). Once you have things looking the way you would like them go to File, Export Map..., and choose the location, format, and resolution for the file you want to export. Then you will have an image file of the map you just laid out that you can use elsewhere.

I realize those instructions are pretty bare bones - if you need more help than that then that should really be a separate question, or the focus on how to get my book A-Z of Arcgis 

Sunday 28 October 2018

What is Phototheodolite and Applications of a Photo theodolite

What is Phototheodolite and Applications of a Photo theodolite

By: Haseeb Jamal NOTES, SURVEYING EQUIPMENT
Phototheodolite
 
 
A photo theodolite is a form of ground camera. It is a combination of camera and theodolite and is used for taking photographs and measuring the angles which the rival plane of collimation makes with base line. Both the theodolite and the camera rotate about a common vertical axis. The instrument is used for terrestrial photogrammetry
It should be noted that the pointing of the theodolite is completely independent of that of the camera, but the horizontal circle, which is located on the top of the camera housing, is fixed in such a way that when the circle reading is zero, the optical axes of the theodolite and camera lie in the same vertical plane. This means that all horizontal directions observed with the theodolite can be easily related to the principal point of the photograph.

Applications of Phototheodolite

Not only is the terrestrial camera useful for mapping construction sites at scales as large as 5 ft. to 1 in., but the photographs can be utilised in a suitable instrument for taking off quantities for earthworks or stock-piles and for directly plotting tunnel profiles and other varied uses. At the other extreme the photo-theodolite can be employed for mapping at small scales and even for extending control.

Wednesday 31 January 2018

1960 to 75 – GIS Pioneering

1960 to 75 – GIS Pioneering

The early 1960 to 1980s was really the time period of GIS pioneering.

The pieces were coming together with advancements in technology:

Map graphics as outputs using line printers.Advances in data storage with mainframe computers.Recording coordinates as data input.

These initial developments in the world of computing is what propelled GIS its next step forward. But what GIS really needed was a brilliant mind to put the puzzle pieces together.

Enter Roger Tomlinson – the father of GIS.

It was during Roger Tomlinson’s tenure with the Canadian government in the 1960s when he initiated, planned and directed the development of the Canadian Geographic System (CGIS). This was a key time in the history of GIS because many consider CGIS as the roots of Geographic Information Systems. CGIS was unique because it adopted a layer approach system to map handling.

Great discoveries and improvements invariably involve the cooperation of many minds. I may be given credit for having blaze the trail of GIS. But when I look at the subsequent development, I feel the credit is due to others rather than just myself.
-Roger Tomlinson

Because of the vast amount of territory Canada occupies, the idea for a Canadian Land Inventory was developed in 1964. But it wasn’t until 1971 that it became fully operational.

The Canadian Land Inventory used soil, drainage and climate characteristics to determine land capability for crop types and forested areas. It quickly recognized that accurate and relevant data was vital to land planning and decision making. Over the years CGIS had been modified and improved to keep pace with technology.

The CGIS wasn’t the only group adopting GIS:

The US Census Bureau were early adopters of some of the core principles of GIS. It was the pioneering work by the US Census Bureau that led to the digital input of the 1970 Census using the data format GBF-DIME (Geographic Base File – Dual Independent Map Encoding).

GBF-DIME became a file format that supported digital data input, error fixing and even choropleth mapping. Using this format, the US Census Bureau began to digitize Census boundaries, roads and urban areas. This was a huge step forward in the history of GIS.

The Ordnance Survey in the UK also started their routine topographic map development. To this very date, the Ordnance Survey is still producing many different GIS data products including every house, every fence, and every stream in every single part of Great Britain.

At this point in the history of GIS, it was in its pioneering stage. It was still on its training-wheels beginning to be fostered by only a select few national agencies around the world.

Where did GIS begin

Where did GIS begin?

Mapping has revolutionized how we think about location. Maps are important decision making tools. They help us get to places. And they are becoming more immersed in our everyday lives.

But where did it all begin?

Advancements in GIS was the result of several technologies. Databases, computer mapping, remote sensing, programming, geography, mathematics, computer aided design, and computer science all played a key role in the development of GIS.

Today, we’ll uncover some of the key moments in the history of GIS that has shaped it what it has become today:

Paper Mapping Analysis with Cholera Clusters

Dr. John Snow used mapping to illustrate how cases of cholera were centered around a water pump. Many people thought the disease was propagating through the air. However, this map helped show that cholera was being spread through the water.

The history of GIS all started in 1854. Cholera hit the city of London, England. British physician John Snow began mapping outbreak locations, roads, property boundaries and water lines.

When he added these features to a map, something interesting happened:

He saw that Cholera cases were commonly found along the water line.

John Snow’s Cholera map was a major event connecting geography and public health safety. Not only was this the beginning of spatial analysis, it also marked the start of a whole field of study: Epidemiology – the study of the spread of disease.

To this date, John Snow is known as the father of epidemiology. The work of John Snow demonstrated that GIS is a problem-solving tool. He put geographic layers on a paper map and made a life-saving discovery.

Thursday 23 November 2017

Types of GIS

Types of GIS 
The following GIS types are not
necessarily mutually exclusive and a GIS application can be always classified under more
than one type.
2.1 Four-dimensional GIS
While spatio-temporal georepresentations can handle two dimensions of
space and one of time, four-dimensional GIS are designed for three dimensions of space and one
of time.
2.2 Multimedia/hypermedia GIS
Multimedia/hypermedia GIS allow the user to access a wide range of georeferenced
multimedia data (e.g., simulations, sounds and videos) by selecting resources from a
georeferenced image map base. A map serving as the primary index to multimedia data in a
multimedia geo-representation is termed a hypermap. Multimedia and virtual georepresentations
can be stored either in extended relational databases, object databases or in
application-specific data stores.
2.3 Web GIS
Widespread access to the Internet, the ubiquity of browsers and the explosion of
commodified geographic information has made it possible to develop new forms of multimedia
geo-representations on the Web.
Many current geomatics solutions are Web-based overtaking the traditional Desktop
environment and most future ones are expected to follow the same direction.
2.4 Virtual Reality GIS
Virtual Reality GIS have been developed to allow the creation, manipulation
and exploration of geo-referenced virtual environments, e.g., using VRML modelling
(Virtual Reality Modelling Language). Virtual Reality GIS can be also Web-based. Applications
include 3D simulation for planning (to experiment with different scenarios).

Thursday 9 March 2017

Lesson Note On Definitions of GIS

Definitions of GIS
Image result for WHAT IS GIS
Geographic Information System (GIS) has been defined in various ways by different authorities. A typical GIS can be understood by looking at its various definitions. In this section, we present different definitions (or descriptions) of GIS that have been offered by people.
Burrough (1986) defines GIS as a "set of tools for collecting, storing, retrieving at will, transforming and displaying spatial data from the real world for a particular set of purposes".
Image result for WHAT IS GIS
In his own definition, Arnoff (1989) defines GIS as "a computer based system that provides four sets of capabilities to handle geo-referenced data: data input, data management (data storage and retrieval), manipulation and analysis, and data output."
“A geographic information system (GIS) is a computer-based tool for mapping and analysing things that exist and events that happen on earth. GIS technology integrates common database operations such as query and statistical analysis with the unique visualisation and geographic analysis benefits offered by maps” (ESRI, 1990).
Image result for WHAT IS GIS
". . . The purpose of a traditional GIS is first and foremost spatial analysis. Therefore, capabilities may have limited data capture and cartographic output. Capabilities of analyses typically support decision making for specific projects and/or limited geographic areas. The map data-base characteristics (accuracy, continuity, completeness, etc.) are typically appropriate for small-scale map output. Vector and raster data interfaces may be available. However, topology is usually the sole underlying data structure for spatial analyses" (Huxhold, 1991 p.27).

"A geographic information system is a facility for preparing, presenting, and interpreting facts that pertain to the surface of the earth. This is a broad definition . . . a considerably narrower definition, however, is more often employed. In common parlance, a geographic information system or GIS is a configuration of computer hardware and software specifically designed for the acquisition, maintenance, and use of cartographic data" (Tomlin, 1990 p xi).
Image result for WHAT IS GIS
"A geographic information system (GIS) is an information system that is designed to work with data referenced by spatial or geographic coordinates. In other words, a GIS is both a database system with specific capabilities for spatially-reference data, as well as a set of operations for working with data . . . In a sense, a GIS may be thought of as a higher-order map" (Star and Estes, 1990, pp. 2-3).
A GIS is "an organised collection of computer hardware, software, geographic data, and personnel designed to efficiently capture, store, update, manipulate, analyse, and display all forms of geographically referenced information" (ESRI, 1990, pp. 1-2).
Image result for WHAT IS GIS
“A Geographic Information System (GIS) is a collection of computer hardware, software and geographic data used to analyse and display geographically referenced information” (URL1).
“A GIS is a computer system capable of capturing, storing, analysing, and displaying geographically referenced information; that is, data identified according to location. (Some GIS) practitioners also define a GIS as including the procedures, operating personnel, and spatial data that go into the system” (URL2).
Image result for WHAT IS GIS
“In the strictest sense, a GIS is a computer system capable of assembling, storing, manipulating, and displaying geographically referenced information, i.e. data identified according to their locations. GIS practitioners also regard the total GIS as including operating personnel and the data that go into the system” (URL2).
“GIS is an integrated system of computer hardware, software, and trained personnel linking topographic, demographic, utility, facility, image and other resource data that is geographically referenced” (URL3).
Image result for WHAT IS GIS
A list of additional definitions of GIS can be found in Longley et al (2001). By way of summary, GIS can be considered to be a computer-based system comprising hardware, software, geographically-referenced data, personnel and procedures put together for the input, storage, retrieval, analysis, manipulation, query, update and output of geographical data.